Keeping Up with the Ride: Motion-Aware Compression for Wireless VR Cycling
George Mason University, Fairfax, Virginia, USA
November 2026
Abstract
A wireless VR cycling game must stream a changing view within a limited video budget as the rider pedals and turns their head. We tested whether Pedaltopia could use the positions of the road, cockpit and hazards to guide regional quantization. Both encodings used fixed foveation and a 16 Mbps video target. On 288 matched frames from the replay used for tuning, adding regional quantization reduced mean squared color error by 15.20 to 16.25% in those regions across both eyes. Structural similarity rose by 0.0108 to 0.0133 in those regions and fell by 0.0098 across the full eye images. Five riders tried both conditions on a stationary trainer under a 21 Mbps Wi-Fi traffic cap. Regional rides used default settings. Median encoded rates ranged from 14.76 to 15.54 Mbps across ten rides. With regional encoding, 95th-percentile software delay ranged from 4.25 ms lower to 4.81 ms higher. Two riders rated the moving scene one point clearer after the regional ride. None chose it as clearer in direct comparison, and one preferred it for another session. On the matched replay, the encoder used the game's region map to preserve more detail in the road, cockpit and hazards with 1.51% fewer encoded bits than fixed foveation alone.
Wireless VR sends every frame through a video encoder with a fixed bit budget. Fixed foveation already keeps the most detail at the center of each eye, but a cyclist who turns toward an opponent moves the road and the cockpit away from that center. The game knows where those things are. This project asks whether passing that knowledge to the encoder keeps them sharper at the same video rate, and whether riders notice. The paper gives the full method, figures and timing appendix.
Explore the study
From game regions to encoder blocks to riders
Walk through the measured block map, the matched replay, each rider’s two rides, and the delay check. Every value comes from the paper; the controls only change what you look at.
Measured map, replay frame 180
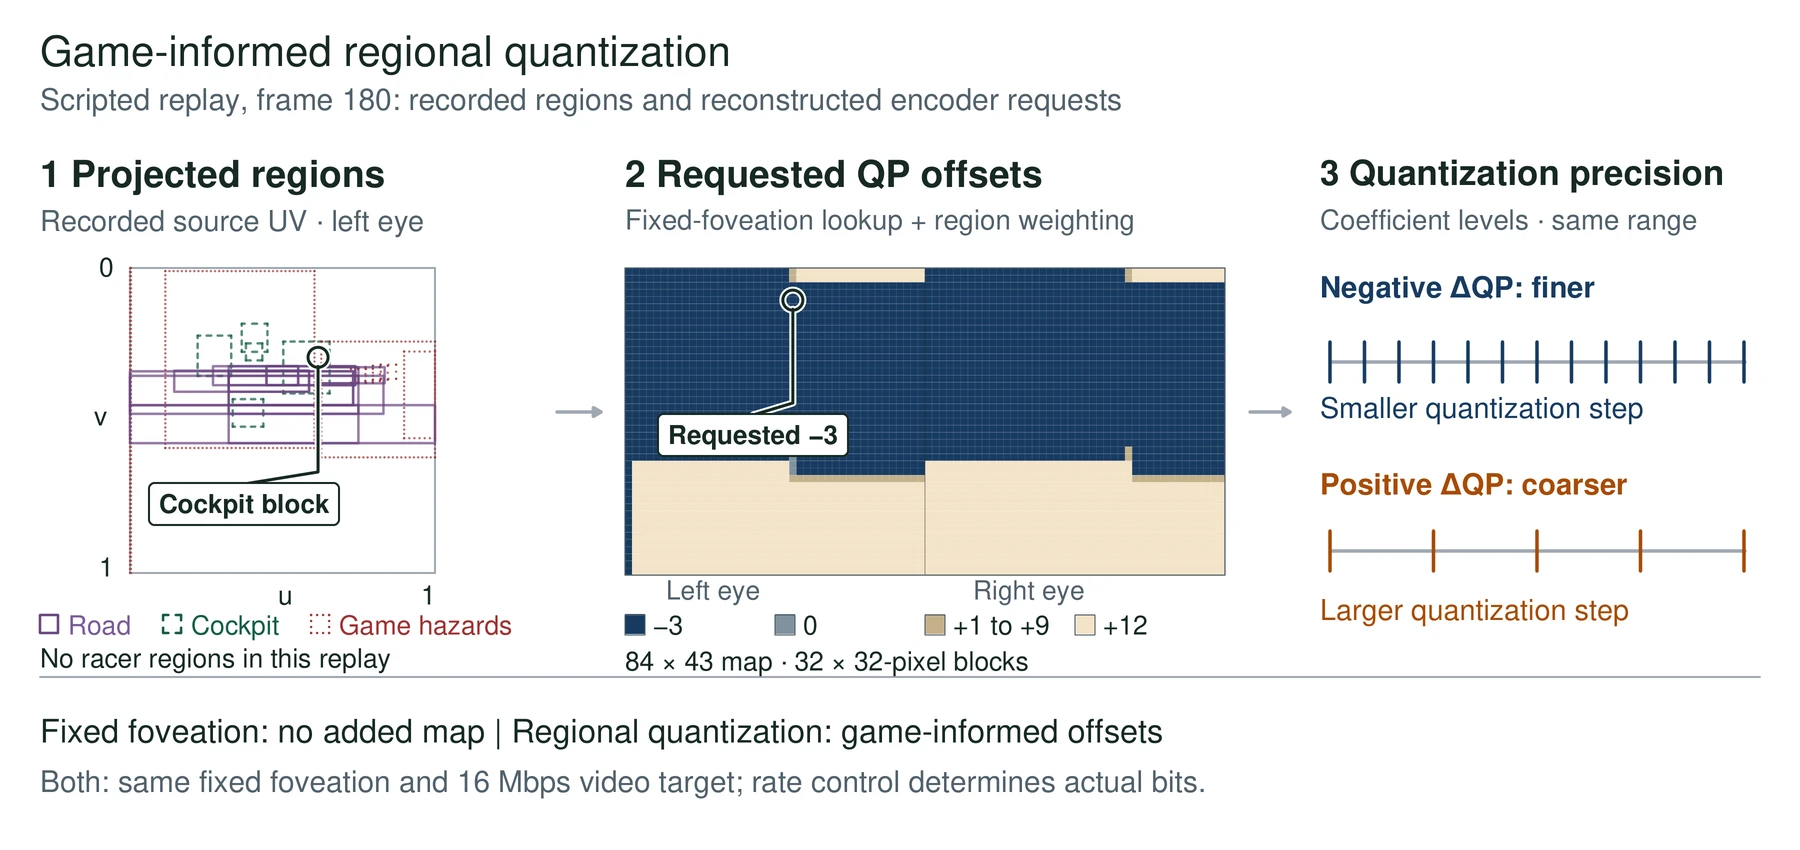
Where the encoder asked for detail
Each cell is one 32×32-pixel encoder block of the stereo frame after fixed foveation, 84 columns by 43 rows. The value is the requested change to the quantization parameter (QP). A negative offset asks for finer precision; a positive offset gives bits away. Point at a block, or focus the map and use the arrow keys.
Column 24, row 5 (left eye): offset -3, finer precision. This is the cockpit block the paper traces from the game view into the encoder map.
From protection to offset
Protection is how much a block is covered by a road, cockpit or hazard rectangle, from 0 to 1. The block weight rises from the background weight (3) to the foreground weight (70). Its offset is −6·log₂(weight ÷ mean weight), rounded and clipped to ±12, then shifted by +1 to keep the frame within its rate budget.
Block weight
70.0
Before shift
-4
Requested offset
-3
Mean weight ≈ 45.5, from this frame's mean protection. The calculator ignores the background falloff toward the image edge, so values between the two extremes are approximate. Full protection gives −3 and none gives +12, which matches the measured map.
Matched replay, same source frames
Detail moves to the task regions
Both encodings received exactly the same 288 scored frames of a scripted ride, so any difference comes from the encoder. Blue bars favor regional quantization; orange bars favor fixed foveation alone.
Percent reduction in mean squared RGB error, regional versus fixed foveation. Positive means less error. Bars share a zero line.
Encoded rate, fixed foveation
15.26 Mbps
Encoded rate, regional
15.03 Mbps (-1.51%)
The regional settings were selected on this same replay, so these numbers describe one tuned operating point. The encoder spent its budget on the road, cockpit and hazards and gave up fidelity elsewhere, which is why the whole-eye scores fall.
Five riders, two rides each
What each rider reported
Every rider pedaled the same course once with fixed foveation alone and once with regional quantization added, at their own pace and with their head free to turn. Questionnaires called the rides only “Ride 1” and “Ride 2”.
| Measure | Fixed (ride 1) | Regional (ride 2) |
|---|---|---|
| Scene clarity while moving 1 to 7 | 5 | 5 |
| Smoothness 1 to 7 | 4 | 5 |
| Enjoyment (IMI) 1 to 7 | 5.71 | 5.29 |
| Sickness, before → after 0 to 20 | 0 → 14 | 1 → 13 |
| Ride time seconds | 169 | 178 |
| Median encoded video rate Mbps | 15.51 | 15.48 |
| p95 software delay ms | 64.22 | 69.03 |
| Longest application frame ms | 110.3 | 119.4 |
Clearer moving scene
No difference
Ride for another session
No preference
Frames encoded with the map
99.75%
Across all five
Two riders rated the regional ride one point clearer and three gave equal scores. Asked directly, nobody chose regional as clearer: one chose fixed, three saw no difference and one could not compare. Three riders already gave the maximum clarity with fixed foveation, which leaves no room to show an increase. With one ride per condition, ride order and familiarity can also move these ratings.
Software delay, p95
Slower for two riders, faster for three
Each point is one rider's regional minus fixed difference in 95th-percentile software delay. The median across all five is -0.07 ms. For the two increases, the slow events spent longer waiting after video decoding. Remove a stage from every event to see how much of the gap remains.
How to read the recalculation
The paper recalculated only the two increases. Removing a stage changes which events fall in the slowest 5%, so the reductions show where the gap concentrated but do not split it between stages. Five riders with one ride per condition cannot establish that regional encoding preserves latency on a later ride.
From Game Objects to Encoder Blocks
The study runs in Pedaltopia, a cycling game from George Mason University where pedaling a stationary trainer moves the rider along a course with computer-controlled opponents. The game streams from a PC to a Meta Quest 3 over Wi-Fi through a patched build of ALVR 20.14.1.
Each frame, Unity projects the road, the cockpit readouts, tagged hazards and nearby racers into each eye and wraps each one in a rectangle. A 60 ms forecast of head direction widens the region it considers during a turn. The encoder side then maps every 32×32-pixel block back through the fixed-foveation transform and measures how much of the block those rectangles cover. That coverage sets a block weight, and the weight becomes a QP offset:
A common shift keeps the whole map inside a rate budget, and NVENC applies the result relative to the QP its own rate controller picks. A block with twice the mean weight starts at −6 and one with half the mean starts at +6. The Block map view above shows a real map from the replay, with the cockpit block the paper traces into the encoder.
A Replay That Isolates the Encoder
Two live rides never show the same images, so I recorded a scripted race with the headset unworn and replayed the identical 360 stereo frames through both encoders at 72 FPS and a 16 Mbps target. After warm-up, 288 frames were scored.
Adding the map cut mean squared color error by 15.20% to 16.25% in the road, cockpit and hazard regions of both eyes, and structural similarity rose in every region. The regional stream also used 1.51% fewer bits. The cost appeared elsewhere: whole-eye similarity fell from 0.9525 to 0.9427, because the encoder moved precision out of the background. The regional settings were tuned on this same replay, so the numbers describe one operating point, not a general gain.
Five Riders, Two Rides Each
Five participants rode the course twice on a Wahoo KICKR Pro, once with fixed foveation alone and once with the regional map, in alternating order. All ten rides used the same 16 Mbps target under a 21 Mbps traffic cap. The encoder applied the map on 97.53% to 99.90% of frames in every regional ride.
The riders did not see a clear difference. Two rated the moving scene one point clearer after the regional ride and three rated both rides equally. Asked directly which ride was clearer, one chose fixed foveation, three reported no difference and one could not compare. One rider chose the regional ride for another session, citing smoother speed changes. Three riders already gave the top clarity score with fixed foveation, which leaves no room to show an improvement.
Delay moved in both directions. The 95th-percentile software delay rose by 4.81 and 3.93 ms for two riders and fell for the other three. For the two increases, slow events spent longer in the queue after video decoding. Removing that queue time from every event shrank the gaps to 0.39 and 1.22 ms.
What This Does and Does Not Show
The replay shows that game geometry can steer encoder precision toward the parts of the view a cyclist uses, without spending more bits. The rider study is small: five people, one ride per condition, free head movement and their own pace. It describes these sessions and does not establish that regional encoding is perceptibly clearer or that it preserves latency.
The useful next test is a task, not a rating: ask riders to read a cockpit value or spot an approaching opponent during a head turn, repeat each condition, and vary the link capacity. A forecast-on versus forecast-off rerun on the same head trajectory would isolate what the 60 ms prediction contributes.
The regional quantization changes to ALVR are public, with a region-publishing hook that can be tested with synthetic geometry. Pedaltopia's game source and assets remain proprietary. Thanks to Dr. Craig Yu, Dr. Bo Han and Habib Alam for their guidance and the bike setup.
@misc{annafee2026wirelessvrcycling,
  author      = {Ahnaf {An Nafee}},
  title       = {Keeping up with the ride: Motion-aware compression
                 for wireless {VR} cycling},
  year        = {2026},
  institution = {George Mason University},
  url         = {https://www.researchgate.net/publication/418141231}
}